Creator Monetization Platform Metrics That Matter
Learn which metrics matter most for a creator monetization platform, from conversion and retention to LTV, mobile engagement, and payment friction. This guide explains how creators and platform owners can track the numbers that actually drive revenue growth.

Key Metrics That Matter for a Creator Monetization Platform
The most useful creator-platform metrics follow the user journey from visit to long-term value. Start with profile conversion and payment completion, then measure activation, first purchase, PPV and message conversion, revenue per visitor, subscriber retention, churn, repeat spending, creator activity, and lifetime value. Revenue alone is a lagging result; these earlier metrics show where growth is leaking and which product change can improve it. This guide defines the core metrics, formulas, and decisions each one supports.
Quick answer
The most useful metrics for a creator monetization platform are the ones that explain how traffic turns into paying fans, how fans stay engaged, and how revenue grows over time. In practice, that means tracking conversion, retention, LTV, monetization depth, payment friction, mobile engagement, and analytics together. If you only watch total revenue or subscriber count, you miss the real reasons behind growth or decline.
Why revenue alone is not enough
Revenue is the result. It is not the explanation.
Two creator businesses can make the same amount of money and still have completely different problems. One may have strong traffic but weak conversion. Another may convert well but lose fans too quickly. A third may have loyal subscribers but low ARPF because monetization stops at the subscription itself.
That is why healthy creator businesses usually need to perform well in five areas at once: conversion, early monetization, retention, monetization depth, and analytics.
A platform that really works does not just host content. It helps creators improve the numbers behind growth.
The 5 metric groups that matter most

To evaluate a creator monetization platform properly, it helps to group metrics by business function.
The first group is financial metrics. These show how efficiently attention turns into money.
The second group is conversion metrics. These explain how visitors become followers, subscribers, buyers, or tippers.
The third group is retention metrics. These show whether fans stay active and keep paying.
The fourth group is content and engagement metrics. These help you understand whether your content and communication style support repeat monetization.
The fifth group is analytics and decision-making metrics. These tell you whether you can actually see what works and improve it.
The strongest creator businesses do not optimize one metric in isolation. They look at how these categories affect one another.
Comparison table: the most important creator monetization metrics
| Metric | What it shows | Directional benchmark | Why it matters | What usually improves it |
| Revenue Per Visitor (RPV) | Revenue per profile visitor | $0.50–$3.00+ | Shows whether traffic monetizes efficiently | Better profile conversion, stronger offers, easier payments |
| Profile Conversion Rate | Visitors who become paying subscribers | 3–10% | Reveals whether the profile turns attention into paid action | Clearer positioning, better navigation, faster onboarding |
| Welcome Message Conversion | Welcome messages that lead to purchase | Personalized performs better | Captures the strongest early intent | Fast welcome flows, relevance, automation |
| PPV Conversion Rate | Paid messages purchased ÷ sent | 30%+ healthy; 50%+ excellent | Shows whether PPV offers, timing, and targeting work | Segmentation, better hooks, lower payment friction |
| Tip Conversion Rate | Active fans who leave tips | 15–25% strong | Reflects emotional engagement and content appeal | Interactive formats, tip prompts, stronger connection |
| Churn Rate | Subscribers lost over a period | 20–40% monthly common; under 20% strong | Shows where revenue leaks | Better retention, reminders, more reasons to return |
| Retention Rate | Subscribers who renew | Varies by niche | Shows continuity of value | Ongoing communication, consistency, relevant offers |
| Subscriber Tenure | Average subscription duration | 44.85 days | Connects relationship quality to revenue potential | Better retention and deeper engagement |
| ARPF | Monthly revenue per active fan | $30–$150+ | Shows monetization quality beyond audience size | More monetization layers and upsells |
| LTV | Total revenue per fan over time | $100–$500+ for stronger fans | Reveals long-term business strength | Retention + monetization depth |
| Chat Engagement Rate | Replies ÷ messages sent | 30–50% common; 60%+ top-tier | Signals relationship health before churn shows up | Better targeting, timing, personalization |
| PPV Sales per Fan | Paid messages bought per fan | 1.5+ good; 2+ strong | Shows repeat monetization beyond the first sale | Better segmentation and repeat purchase flows |
| Mobile Engagement Rate | Interaction from mobile devices | ~84% traffic is mobile | Mobile UX directly affects conversion and retention | Vertical-friendly formats, app-like experience |
| Messages per Hour | Messages handled by a team per hour | ~50/hour | Helps balance quality and efficiency in chat ops | Better tooling, templates, routing, prioritization |
These are directional benchmarks. Actual results vary by niche, traffic quality, pricing, audience behavior, and platform setup.
Financial metrics that show whether your platform really monetizes attention
Revenue Per Visitor (RPV)
Revenue Per Visitor measures total revenue divided by profile visitors.
This is one of the clearest ways to understand whether attention is actually turning into money. If your site gets traffic but your RPV stays weak, then the problem is not traffic alone. It may be the offer, the profile structure, the payment flow, or the monetization depth.
A practical benchmark for creator businesses is roughly $0.50 to $3.00+ per visitor, depending on niche and traffic intent. The goal is not to obsess over one perfect number. The goal is to improve how efficiently attention turns into action.
Average Revenue Per Fan (ARPF)
ARPF measures monthly revenue divided by active fans.
This metric moves the conversation beyond audience size. A creator may have 1,000 active fans, but if those fans only pay once and disappear, the business is much weaker than it looks. A useful reference range can be $30 to $150+ per fan per month, depending on pricing and monetization mix.
Lifetime Value (LTV)
LTV measures the total revenue generated by a fan across the whole relationship.
This is one of the most important metrics in the business because a fan is rarely worth just one subscription payment. They may subscribe, buy PPV, tip, purchase paid attachments, join a paid event, or pay for private appointments over time.
A practical directional benchmark for stronger fans can be $100 to $500+ over the relationship. The higher your retention and monetization depth, the more room there is for LTV to grow.
Conversion metrics that shape the first purchase
Many creator businesses lose money before retention even becomes the problem.
If a visitor never subscribes, never buys the first PPV, or never reacts to the first message, then the platform has already failed at the most important stage.
Profile Conversion Rate
Profile Conversion Rate measures how many visitors turn into paying subscribers.
A common directional benchmark is roughly 3% to 10%, depending on niche and traffic quality. If it is lower, the problem may be unclear positioning, weak content discovery, poor profile structure, or too much friction in registration and payment.
Welcome Message Conversion
Welcome Message Conversion shows how often the first message leads to a purchase or other meaningful action.
There is no single universal benchmark here, but one pattern is consistent: personalized welcome flows outperform generic ones. Timing matters too. A late welcome message often means a missed monetization opportunity.
PPV Conversion Rate
PPV Conversion Rate measures purchases of paid messages divided by paid messages sent.
A healthy benchmark can be 30%+, while 50%+ is a strong result for well-targeted offers. If PPV conversion is low, the problem may be poor timing, weak hooks, broad targeting, or too much friction between interest and payment.
Tip Conversion Rate
Tip Conversion Rate measures the share of active fans who leave tips.
A rough benchmark of 15% to 25% is a strong signal. Tips matter because they often reflect something deeper than simple access. They show emotional engagement, stronger connection, and a higher willingness to support the creator directly.
The first 48 hours matter more than most creators think
This is one of the highest-leverage parts of the entire fan journey.
Some of the most useful benchmark data in creator monetization points to a clear pattern: 29.5% of fans make a purchase on the day they subscribe. At the same time, 50.3% stop engaging after 2 days without contact, and less than 5% stay active longer than 10 days.
That changes how onboarding should be viewed.
The first 48 hours are not a minor setup phase. They are often the most important monetization window on the platform.
Why this window is so valuable
A new fan is at peak curiosity right after joining, when attention is high and interest still feels fresh. This is the moment when they are most likely to open a message, explore locked content, or respond emotionally.
If nothing meaningful happens in that window, the relationship starts cold. If the creator or platform uses it well, early monetization becomes much easier.
What usually breaks early conversion
Most early failures come from the same few issues:
- the creator replies too late
- the welcome message feels generic
- the payment flow has too many steps
- the new fan does not quickly find content worth buying
These are not abstract marketing problems. They are workflow and product problems.
What helps
This is where platform mechanics matter. Automated welcome flows, low-friction payments, social login, better profile discovery, and segmented first-touch communication can all protect that early momentum.
That is why features like Welcome Messages, Lists, Purchase from Balance, Subscription from Balance, and Social Login matter in practice. They do not just add convenience. They help convert the most valuable moment in the fan lifecycle.
Payment flow is part of monetization, not just UX
A common mistake in creator businesses is treating checkout like a technical detail.
It is not a technical detail. It is a revenue metric.
Every extra click, every extra form field, and every extra request for payment details creates another chance for the fan to hesitate or leave. This can drag down several KPIs at once:
- Profile Conversion Rate
- RPV
- PPV Conversion Rate
- first-day purchase behavior
- even retention, if the first paid experience feels frustrating
For creators and platform owners, smoother payment flow is not just a UX win. It is monetization infrastructure. When friction drops, conversion often improves across multiple stages of the funnel.
Retention depends on communication, not just content quality
When fans churn, many people assume the content must be the problem.
Sometimes that is true. But often the bigger issue is that the creator disappeared from the fan’s attention. The fan did not get reminded, did not get re-engaged, and did not feel part of an ongoing relationship.
That is why retention is not only a content problem. It is a communication problem too.
Churn Rate
Churn measures the percentage of subscribers who leave over a period.
For creator businesses, a monthly churn range of 20% to 40% can be common, while under 20% is a much healthier signal. If churn stays high, the business becomes too dependent on constant acquisition.
Retention Rate
Retention shows the percentage of subscribers who continue.
If churn tells you what is being lost, retention tells you what is being kept. It reflects how well the creator or platform maintains perceived value over time.
Subscriber Tenure
Subscriber Tenure measures the average length of the relationship.
A useful benchmark places average subscriber tenure at 44.85 days. That number matters because it ties retention directly to monetization potential. The longer the tenure, the more chances there are for PPV, tipping, events, premium content, and renewals.
Chat Engagement Rate
Chat engagement measures replies divided by sent messages.
A directional benchmark of 30% to 50% is common, while 60%+ is a top-tier signal. This metric matters because engagement often weakens before churn becomes obvious. If fans stop replying, they usually stop buying soon after.
What improves retention in practice
Retention gets stronger when the creator stays visible without becoming repetitive. That usually means:
- timely reminders
- relevant mass messages
- segmented outreach
- consistent content rhythm
- multiple reasons to return
This is why features like Push Notifications, Lists, liked content mechanics, and scheduled communication can support retention. The goal is not more noise. It is better continuity.
LTV grows through monetization depth, not just audience size
This is one of the most important strategic ideas in the article.
A creator business does not improve LTV only by getting more followers. It improves LTV by giving each fan more ways to spend over time.
If the only monetization channel is subscription access, revenue potential stays narrow. But once the platform supports multiple revenue layers, the fan relationship becomes deeper.
That may include:
- subscriptions
- paid messages
- paid attachments
- tipping
- stories and casual engagement
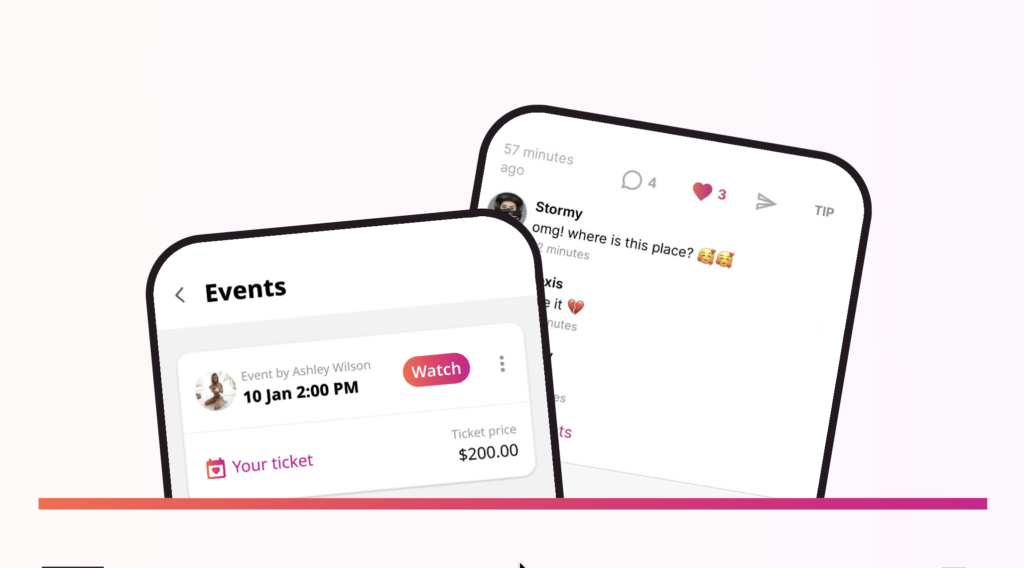
- paid events
- appointments
- exclusive content packs
PPV Sales per Fan
This metric shows how many paid messages each fan buys on average.
A directional benchmark of 1.5+ is a good sign, and 2+ is strong. It is useful because it shows whether monetization extends beyond the first sale.
Content-to-Revenue Ratio
This metric helps connect content type to income.
One strong benchmark example suggests that photos combined with personal messages can drive up to +340% in tipscompared with flatter, less personal approaches. That is exactly the kind of insight creators need. It shows that content format is not just aesthetic. It directly shapes monetization behavior.
Why format variety matters
LTV often stalls because the monetization experience becomes flat. Fans see the same kinds of offers, the same interaction pattern, and the same content structure.
Stories, text posts, attachments, live interactions, events, and premium experiences create more monetization depth. That is what lifts ARPF and LTV over time.
Mobile engagement is not optional anymore
In many creator businesses, roughly 84% of traffic comes from mobile devices.
That one number changes how the whole platform should be evaluated.
If most attention, browsing, and buying happens on mobile, then mobile experience is not a side issue. It affects discovery, content viewing, message reading, checkout, and repeat engagement.
Mobile Engagement Rate
Mobile Engagement Rate measures how actively users interact from mobile devices.
This matters because mobile users are less patient. They move fast, skim more, and leave faster when the experience feels clunky.
What that means in practice
A creator platform needs more than responsive design. It needs:
- fast loading
- clearer navigation
- vertical-friendly content
- fast message flow
- easier payment actions
- an app-like feel where possible
That is why stories, short-form mobile-friendly formats, and PWA-style experiences can affect more than engagement. They can influence conversion and retention too.
Analytics is not a nice-to-have
Many creator platforms talk about monetization tools. Far fewer help people understand which tools and which content actually produce money.
That is a serious weakness because growth becomes random when there is no visibility into outcomes.
A creator may feel busy all month and still not know:
- which posts generated revenue
- which mass message performed best
- which content format drives more tips
- which fans spend the most
- which monetization layers actually lift LTV
That is why analytics should not sit at the edge of the roadmap. It should sit close to the center.
Why analytics matters operationally
One of the most common problems in creator monetization is the lack of clear visibility into which content is profitable and which is not.
That means creators cannot optimize intelligently. They keep posting, messaging, and experimenting, but without enough clarity to scale what works.
What should be visible
At minimum, strong creator analytics should help answer:
- Which posts drove revenue?
- Which mass messages converted?
- Which fan segments spend more?
- Which content formats increase tips or PPV?
- Which creators or workflows need support?
This is where metrics become action. Visibility turns performance data into better decisions.
What creators should track vs what platform owners should track
Not everyone needs the same dashboard.
What creators should watch weekly
Creators usually benefit most from watching the metrics that shape day-to-day actions:
- Profile Conversion Rate
- Welcome Message Conversion
- PPV Conversion Rate
- Tip Conversion Rate
- Chat Engagement Rate
- churn signals
- subscriber tenure trends
These numbers answer practical questions. Is the first message working? Are paid offers landing? Are fans cooling off? Is engagement still alive?
What platform owners should watch monthly
Owners and operators need a wider lens. They should usually track:
- RPV
- ARPF
- LTV
- churn and retention by segment
- onboarding friction points
- payment friction points
- monetization tool adoption
- content format performance across creators
Creators optimize actions. Platform owners optimize systems. Good analytics should support both.
What high-performing creator monetization platforms have in common
The best-performing creator platforms rarely win because they have the longest feature list.
They win because their mechanics support business outcomes.
These platforms usually make first-touch communication faster. They reduce payment friction and support more than one monetization layer. They work well on mobile and they help creators stay visible after the first purchase. And they show enough analytics to make improvement possible.
That is the real difference between a basic content site and a creator monetization platform built for growth.
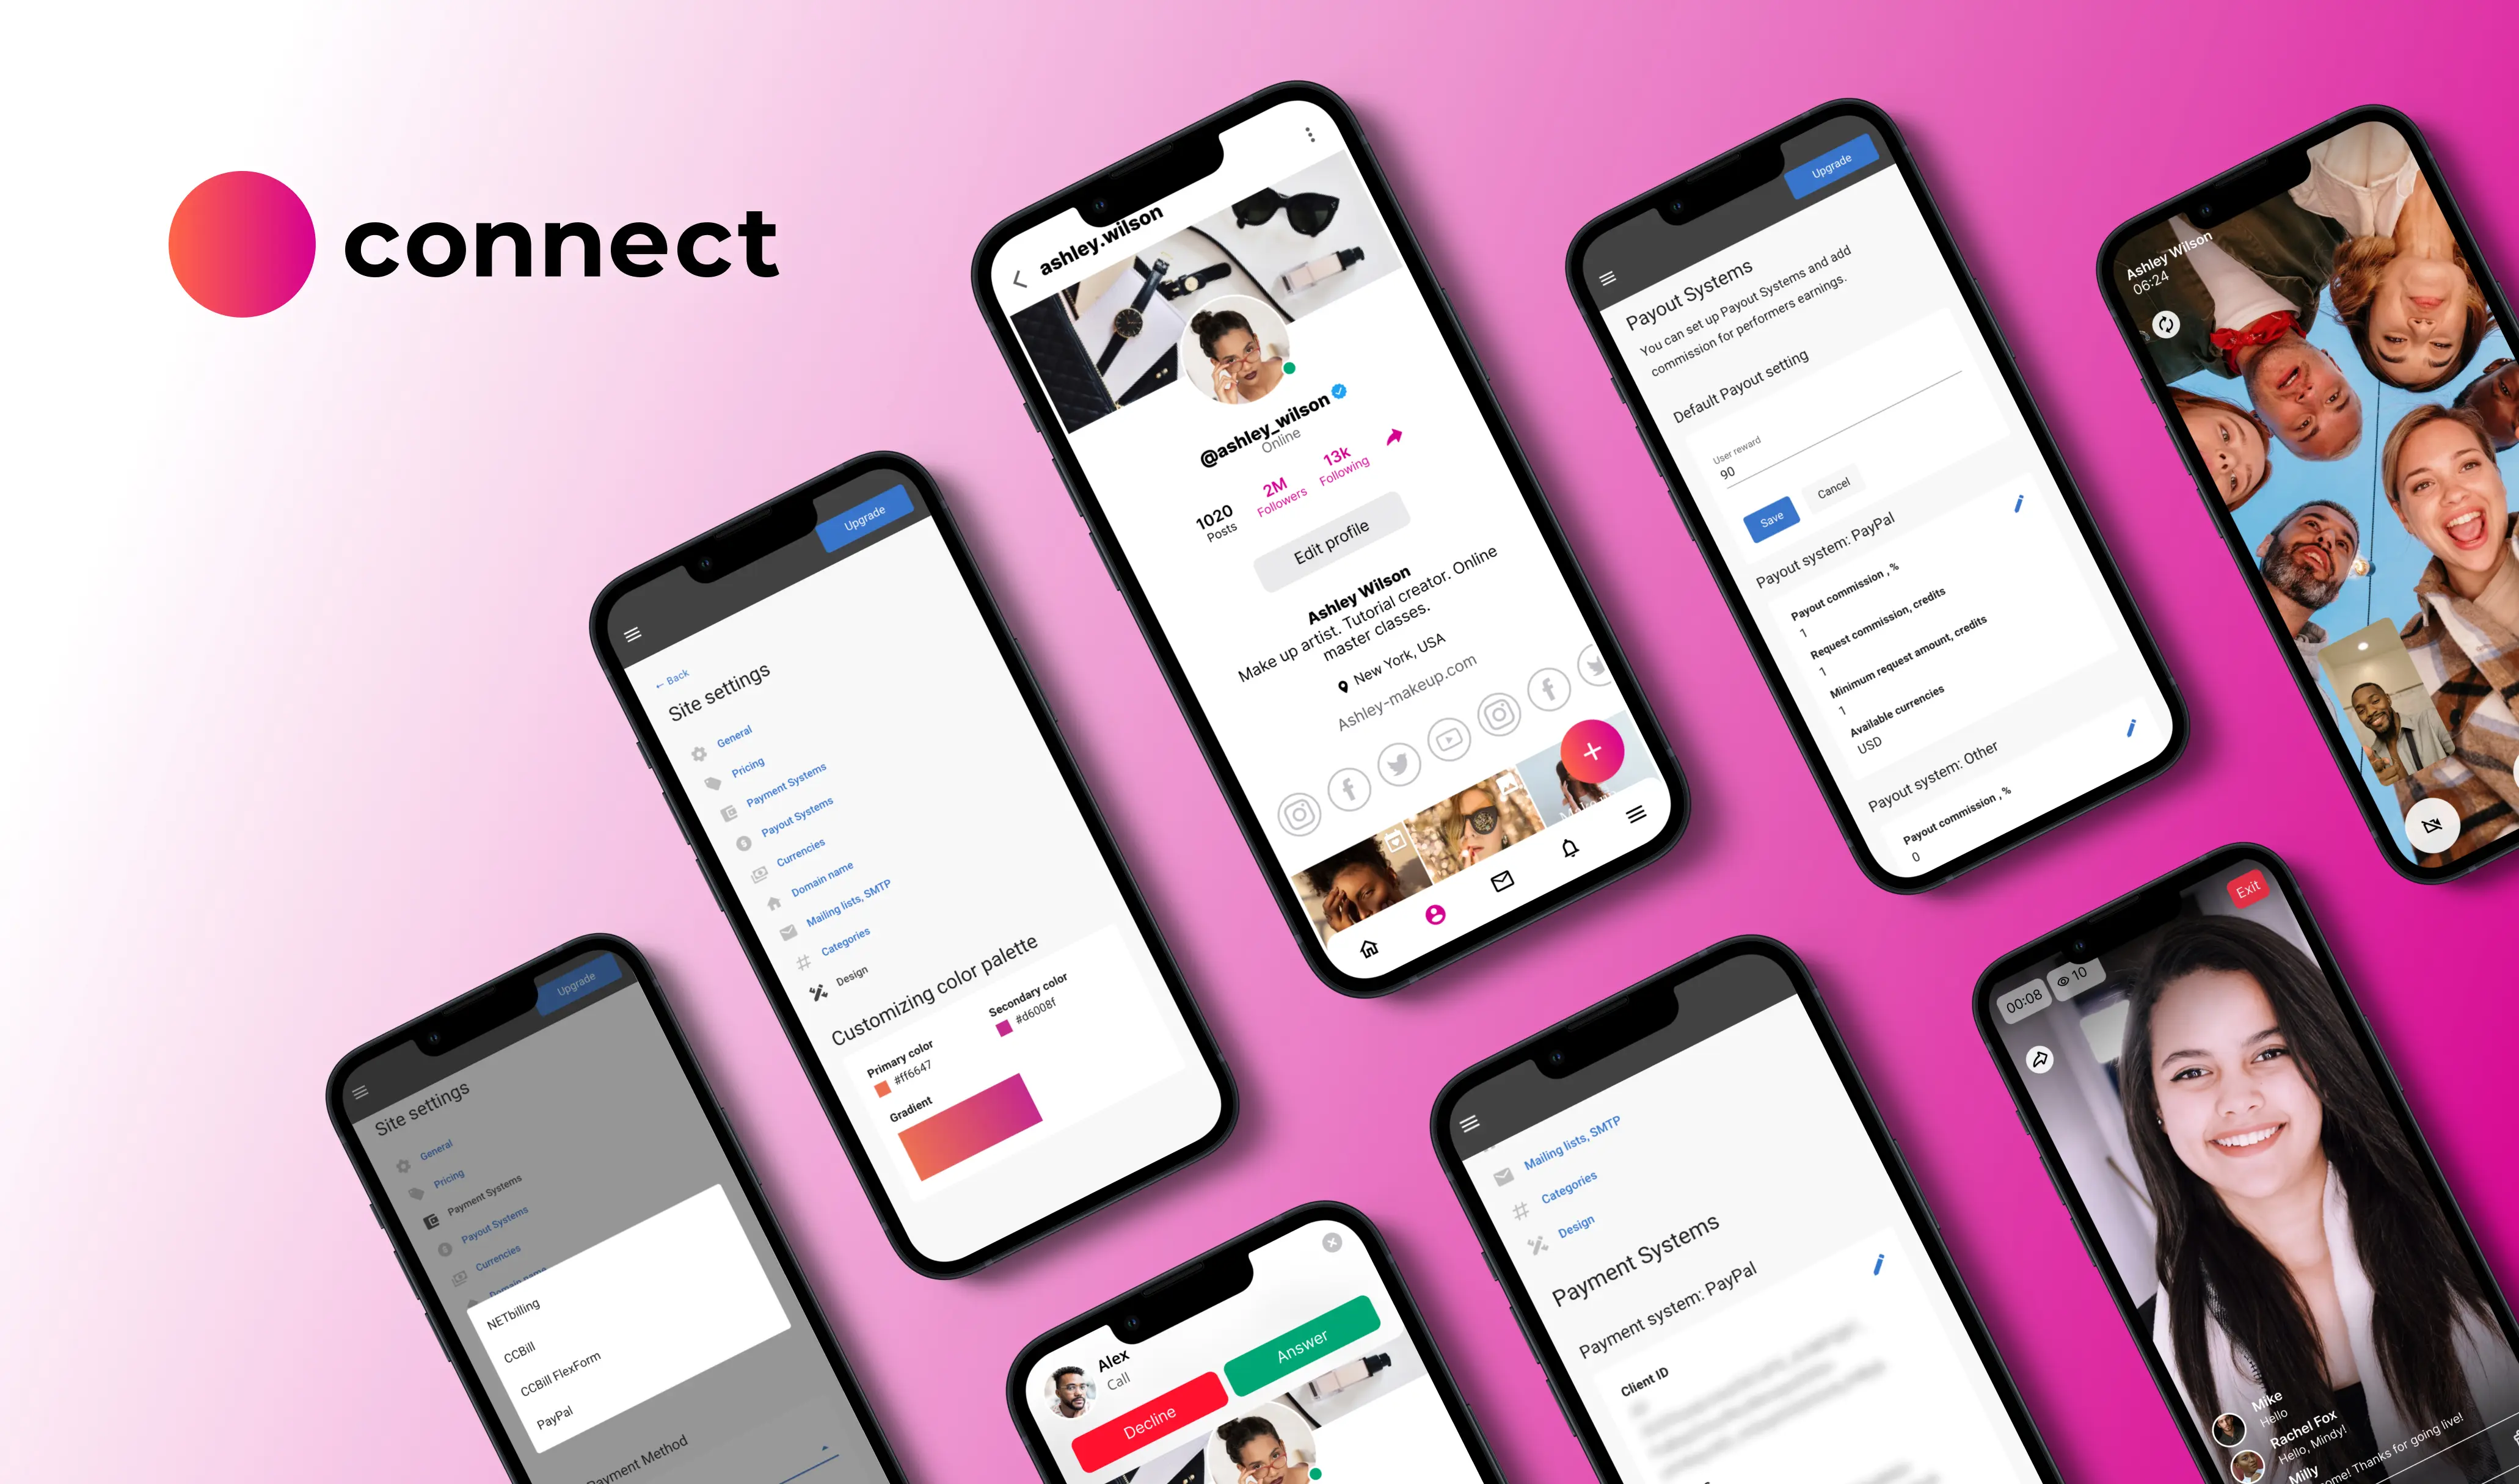
How Scrile Connect helps improve creator monetization metrics
Tracking metrics is only useful if the platform gives creators and operators real ways to improve them.
That is where infrastructure starts to matter. A creator monetization platform should not just host content. It should help reduce friction, support faster monetization, improve retention, and make performance more visible.
Scrile Connect is built around that logic. Instead of limiting creators to a narrow subscription flow, it gives them more control over the parts of the fan journey that directly affect revenue, retention, and long-term value.
Features that support conversion, retention, and LTV
For example, the first 48 hours often have an outsized impact on monetization. Tools like Welcome Messages, Lists, and smoother onboarding flows can help creators respond faster, personalize the first touchpoint, and make it easier for new fans to act while interest is still high.
Conversion also depends heavily on payment friction. Features such as Purchase from Balance, Subscription from Balance, and optional social login help remove unnecessary steps between intent and purchase. That can support better Profile Conversion Rate, PPV Conversion Rate, and overall Revenue Per Visitor.
Retention and engagement improve when creators can stay visible without relying only on manual outreach. Push Notifications, audience segmentation, scheduled communication, and liked-content mechanics make it easier to re-engage fans in a more relevant way instead of depending on broad, repetitive mass messaging.
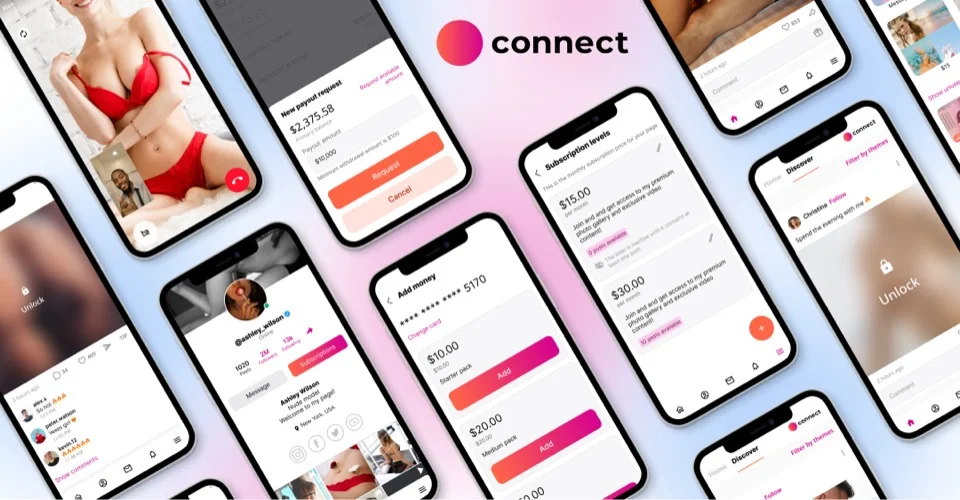
LTV and ARPF usually grow when fans have more than one way to spend. Scrile Connect supports that through a wider monetization mix, including subscriptions, paid messages, paid attachments, tipping, Stories, text posts, appointments, paid events, and other premium interactions. That gives creators more ways to deepen fan relationships over time instead of depending on one revenue stream alone.
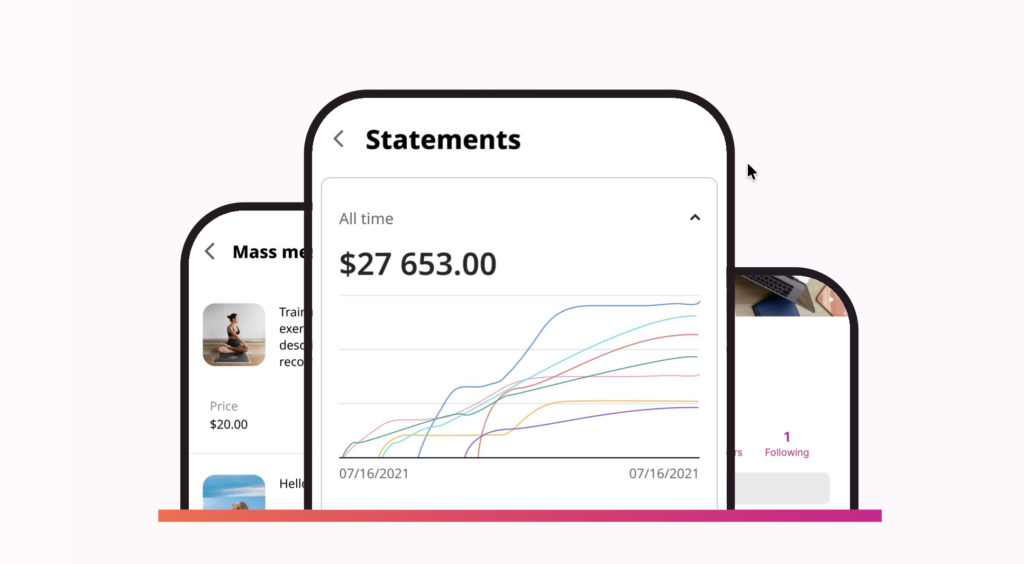
Visibility and analytics that help teams improve performance
Analytics is another part of the equation. Scrile Connect includes creator-facing and admin-side visibility through tools like Profile Like Stats, Mass Message Statistics, Statements, and revenue-related post insights, so teams can see which content, campaigns, and monetization flows are actually working.
In other words, Scrile Connect is not just about launching a creator platform. It is about giving creators and operators more control over the metrics that shape growth.
P.S. For live-streaming and webcam platforms, the metric stack is slightly different. Revenue still depends on conversion, retention, and fan value, but operators usually pay more attention to metrics such as private show conversion, average revenue per model, tip volume, media sales, fanclub retention, off-hours revenue, and mobile broadcasting activity.
Final thoughts
If you want to measure the success of a creator monetization platform, start by looking beyond revenue totals.
Ask what happens in the first 48 hours. Look at how many visitors become paying fans. Check whether payment friction is cutting off sales. Measure whether fans stay engaged long enough to renew and spend again. Watch whether mobile behavior is helping or hurting monetization. And make sure your analytics show which content and communication patterns are actually driving results.
The strongest creator businesses do not grow by accident. They grow because they understand which metrics matter and build systems that improve them.
That is where platform design starts to matter. If your infrastructure supports stronger onboarding, lower friction, deeper monetization, better mobile engagement, and clearer analytics, it becomes much easier to improve conversion, retention, and long-term fan value.
For creators and businesses that want more control over those outcomes, that is where a flexible platform like Scrile Connect becomes valuable. It is not just about publishing content. It is about building a creator business that can actually improve the numbers behind growth.
FAQ: creator monetization platform metrics
What are the most important metrics for a creator monetization platform?
The most important metrics usually include Revenue Per Visitor, Profile Conversion Rate, Welcome Message Conversion, PPV Conversion Rate, Tip Conversion Rate, Churn Rate, Retention Rate, Subscriber Tenure, ARPF, and LTV. Together, they show how well the platform turns attention into revenue and keeps fans engaged over time.
Why is total revenue not enough to measure platform success?
Total revenue only shows the final outcome. It does not explain whether the platform converts well, retains fans efficiently, or grows lifetime value in a sustainable way. To understand performance properly, you need supporting metrics that show where money is made and where it is lost.
Why do the first 48 hours matter so much?
Because that is often the highest-intent part of the fan journey. Commonly cited benchmark data suggests that 29.5% of fans make a purchase on the day they subscribe, while 50.3% stop engaging after two days without contact. That makes early communication, strong welcome flows, and low-friction monetization especially important.
What is a good Revenue Per Visitor for a creator platform?
A directional benchmark is around $0.50 to $3.00+, depending on niche, traffic quality, and monetization model. The real goal is not to hit one universal number, but to improve how efficiently traffic becomes subscriptions, tips, PPV sales, and repeat spending.
How can creators improve PPV Conversion Rate?
PPV Conversion Rate usually improves through better segmentation, stronger offer positioning, better timing, and lower payment friction. Generic mass messaging tends to convert worse than targeted outreach, especially when the same message is sent to audiences with very different spending behavior.
What affects churn on a creator monetization platform?
Churn is often affected by weak communication, repetitive content, poor re-engagement, and a lack of reasons to return. Fans do not always leave because content is bad. In many cases, they leave because the creator stops showing up consistently in their attention.
How does LTV grow on a creator platform?
LTV grows when fans stay longer and have more ways to spend over time. That usually means combining subscriptions with PPV, tips, paid content, appointments, events, and other premium interactions. It is not just about getting more fans. It is about increasing the value of each fan relationship.
Why is mobile engagement important for creator businesses?
Because most creator traffic now comes from mobile devices. If the platform feels awkward on a phone, it can hurt profile discovery, purchases, message engagement, and retention. Mobile engagement matters because it affects several important metrics at once, not just content consumption.
What analytics should creators and platform owners pay attention to?
Creators should focus on weekly monetization and engagement metrics, such as welcome conversion, PPV conversion, tips, chat engagement, and churn signals. Platform owners should also track broader metrics such as RPV, ARPF, LTV, retention by segment, payment friction, and monetization tool adoption across creators.
How do platform features influence creator revenue metrics?
Features influence revenue metrics when they reduce friction or strengthen engagement. Welcome automation can improve early conversion. Better payment flows can lift PPV sales. Notifications can support retention. Richer content formats can increase ARPF and LTV. Analytics can help creators identify what is actually working and double down on it.
